Coral Bleaching Map
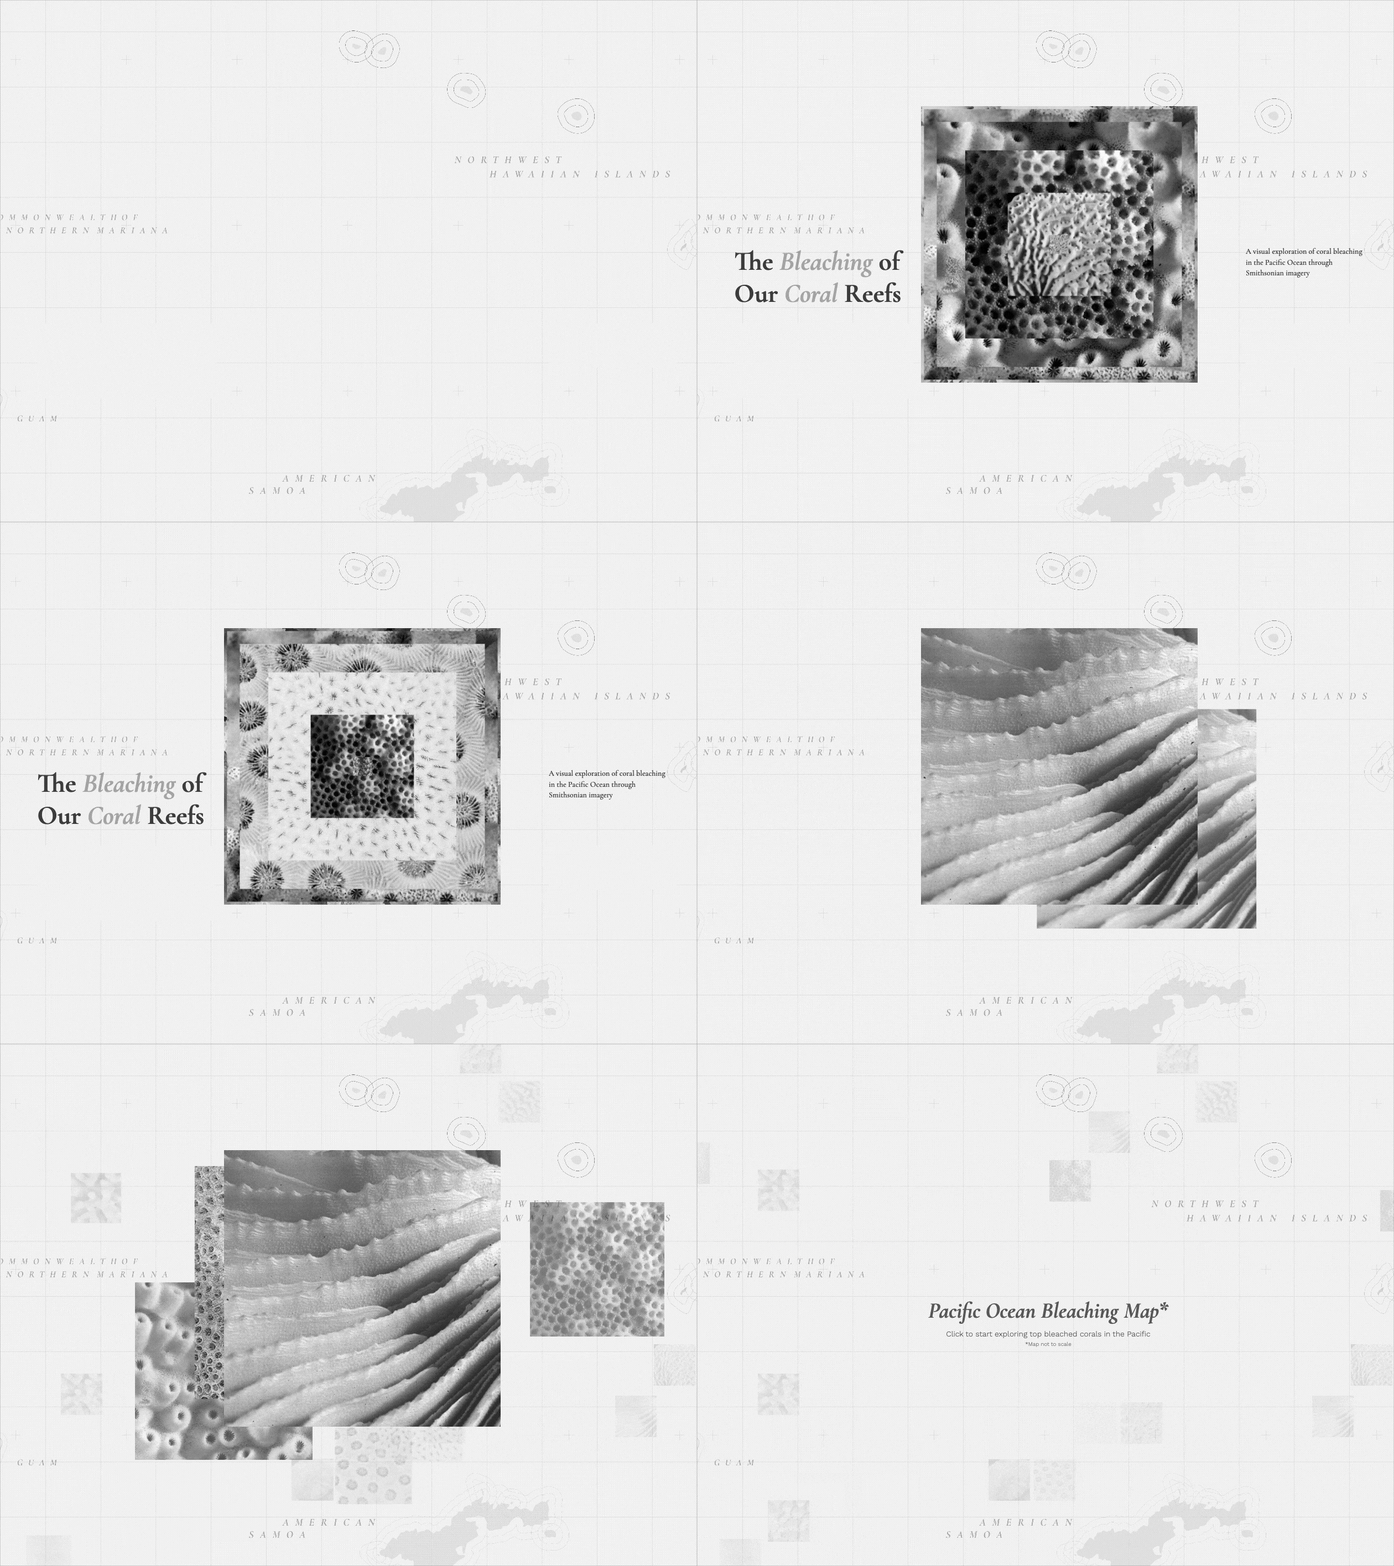
This interactive visualization, using NOAA data and Smithsonian coral images, highlights the vulnerability of Pacific reefs to bleaching but offers hope through signs of resilience in protected marine areas like American Samoa.
TOOLS
D3.js, HTML, CSS, Photoshop
TEAM
Ian Yu
ROLE
Design, Dev, & Research / Data Collection
Full Project Walkthrough
BACKGROUND
Corals become bleached when environmental stressors like changes in temperature, light, or nutrient levels cause them to expel the algae that live within their tissues. This loss of algae, which help provide color and energy, leaves the corals white. Elevated water temperatures are a common trigger for this process.
ABOUT THE DATA / DESIGN
The National Coral Reef Monitoring Program tracks key indicators of U.S. coral reef health, including bleaching prevalence (defined as the proportion of bleached to total corals). We used a black-and-white aesthetic to highlight coral reefs' fragile beauty and the risk of losing them if we don’t reduce our carbon footprint.
WHY IT MATTERS
As more reefs become bleached, their natural ability to buffer storm energy weakens, increasing flood risks for nearby communities. In Florida alone, projected reef loss could put over 7,300 people at greater flood risk and cost an estimated $823.6 million annually in flood damage. Protecting coral reefs is essential for safeguarding ecosystems, economies, and coastal infrastructure.
What is Coral Bleaching?
If users are unfamiliar with coral bleaching, we have a page that introduces the topic.
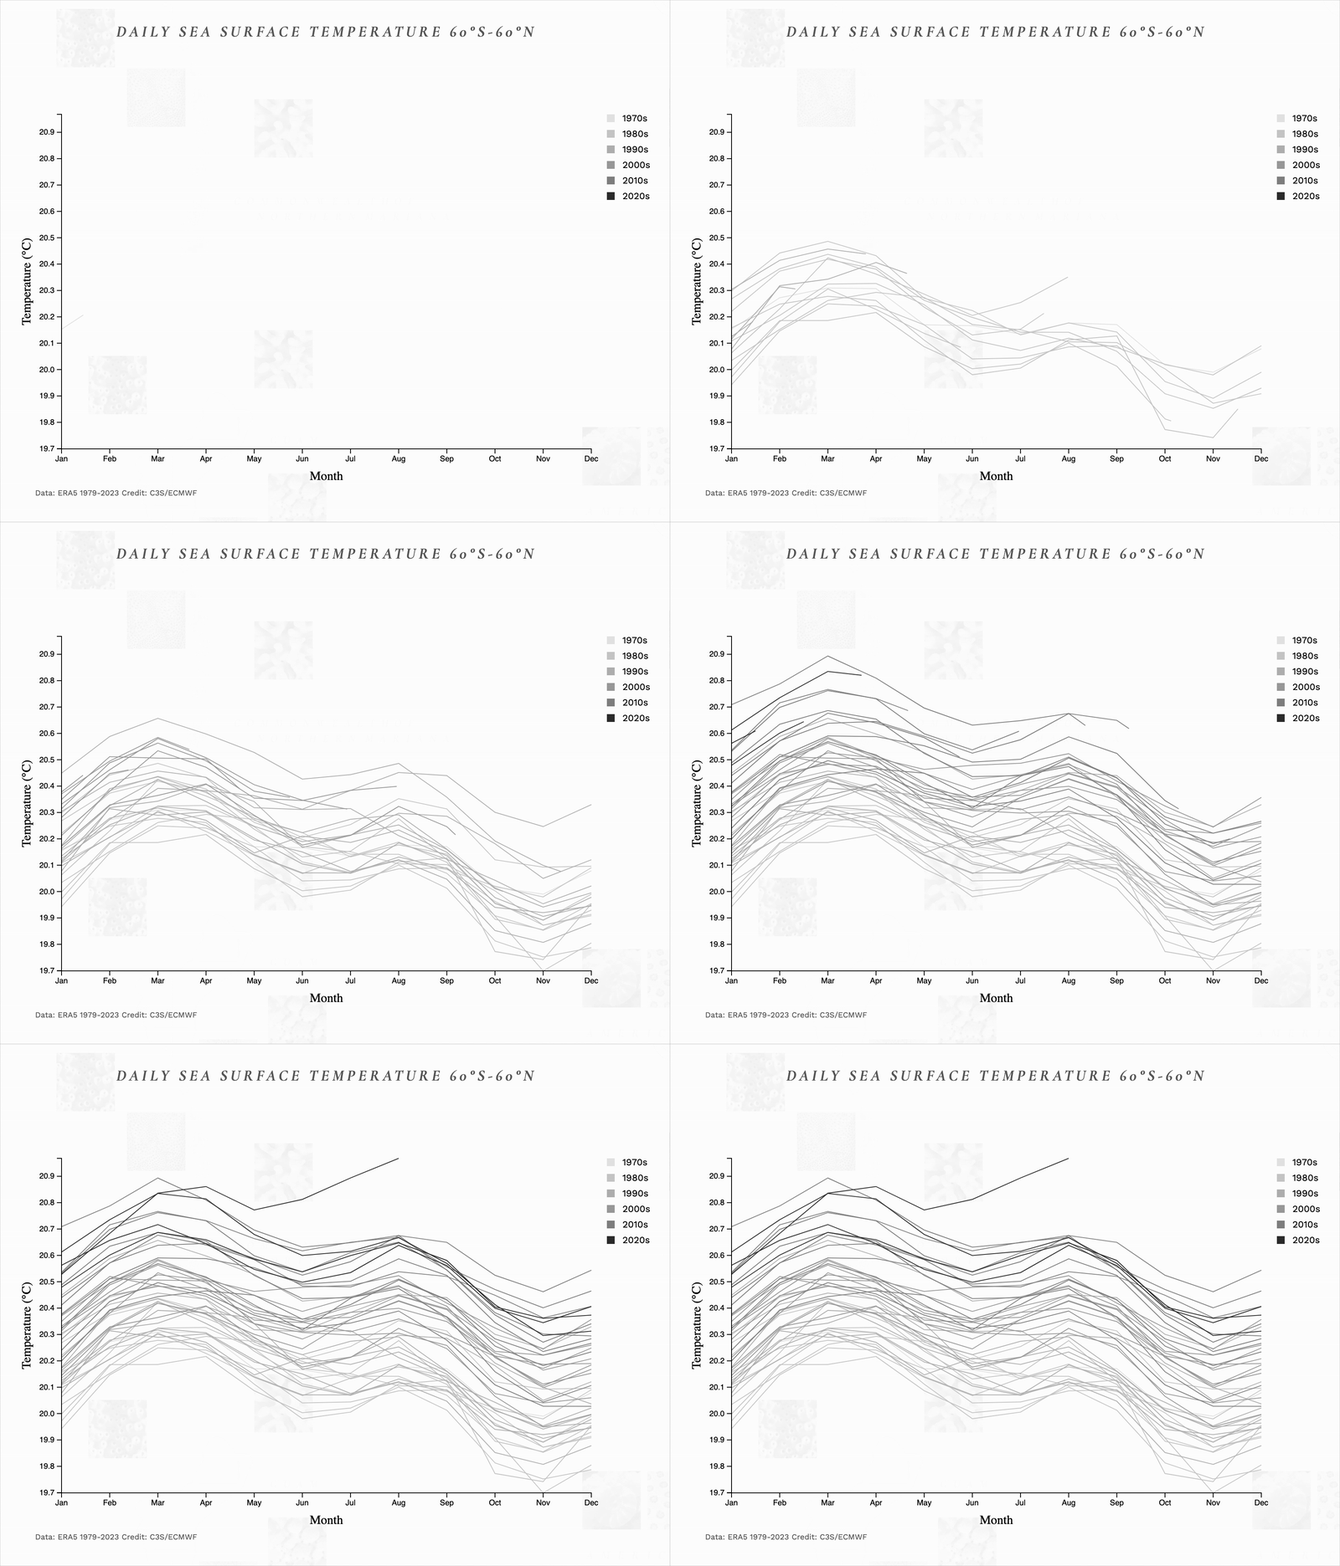
The leading cause of coral bleaching is climate change. A warming planet means a warming ocean, and a change in water temperature (as little as 2 degrees Fahrenheit) can cause coral to drive out algae.
Nutrient imbalances that stress the symbiotic algae (zooxanthellae) living within the coral make them more vulnerable to environmental stressors.
The Map*
*Map is not to scale
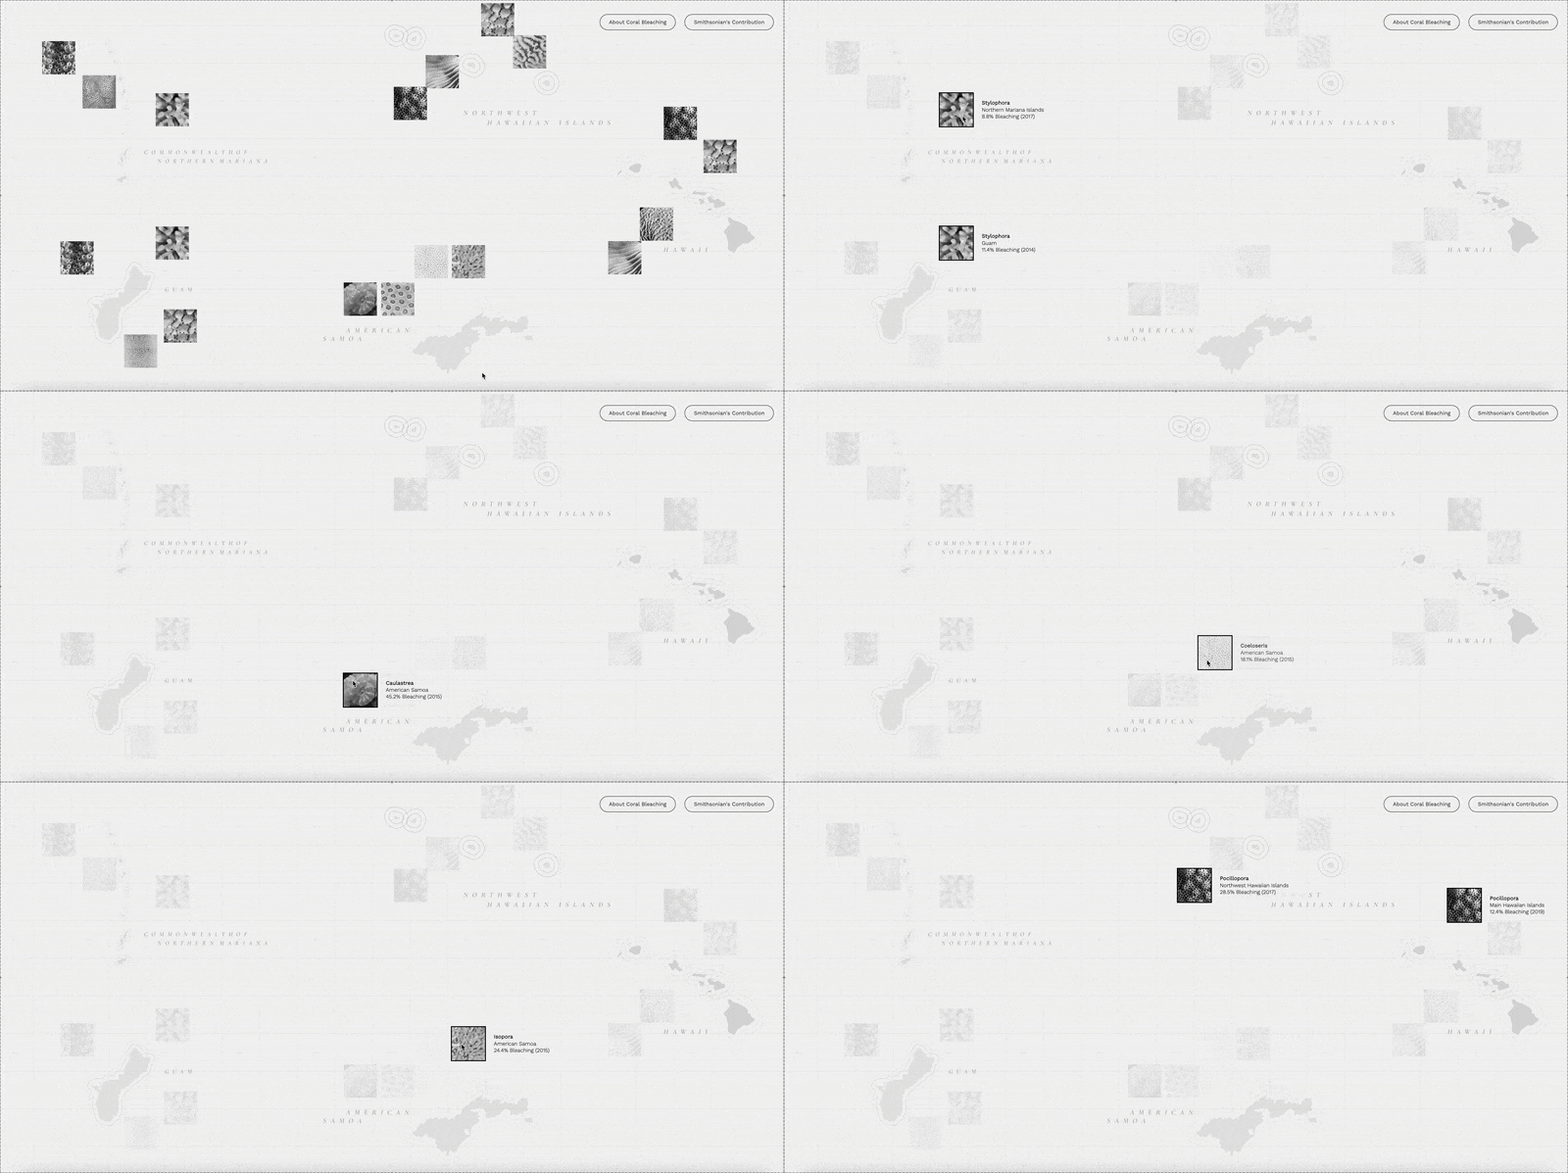
The map artistically clusters images of the most bleached corals, positioned to represent their respective Pacific Ocean jurisdictions. Hover over an image to learn the year of peak bleaching and the genus of the affected coral.
Additionally, hovering over coral images highlights genera shared across regions with frequent bleaching, revealing potential patterns in bleaching occurrences.
Coral Modal Functionality
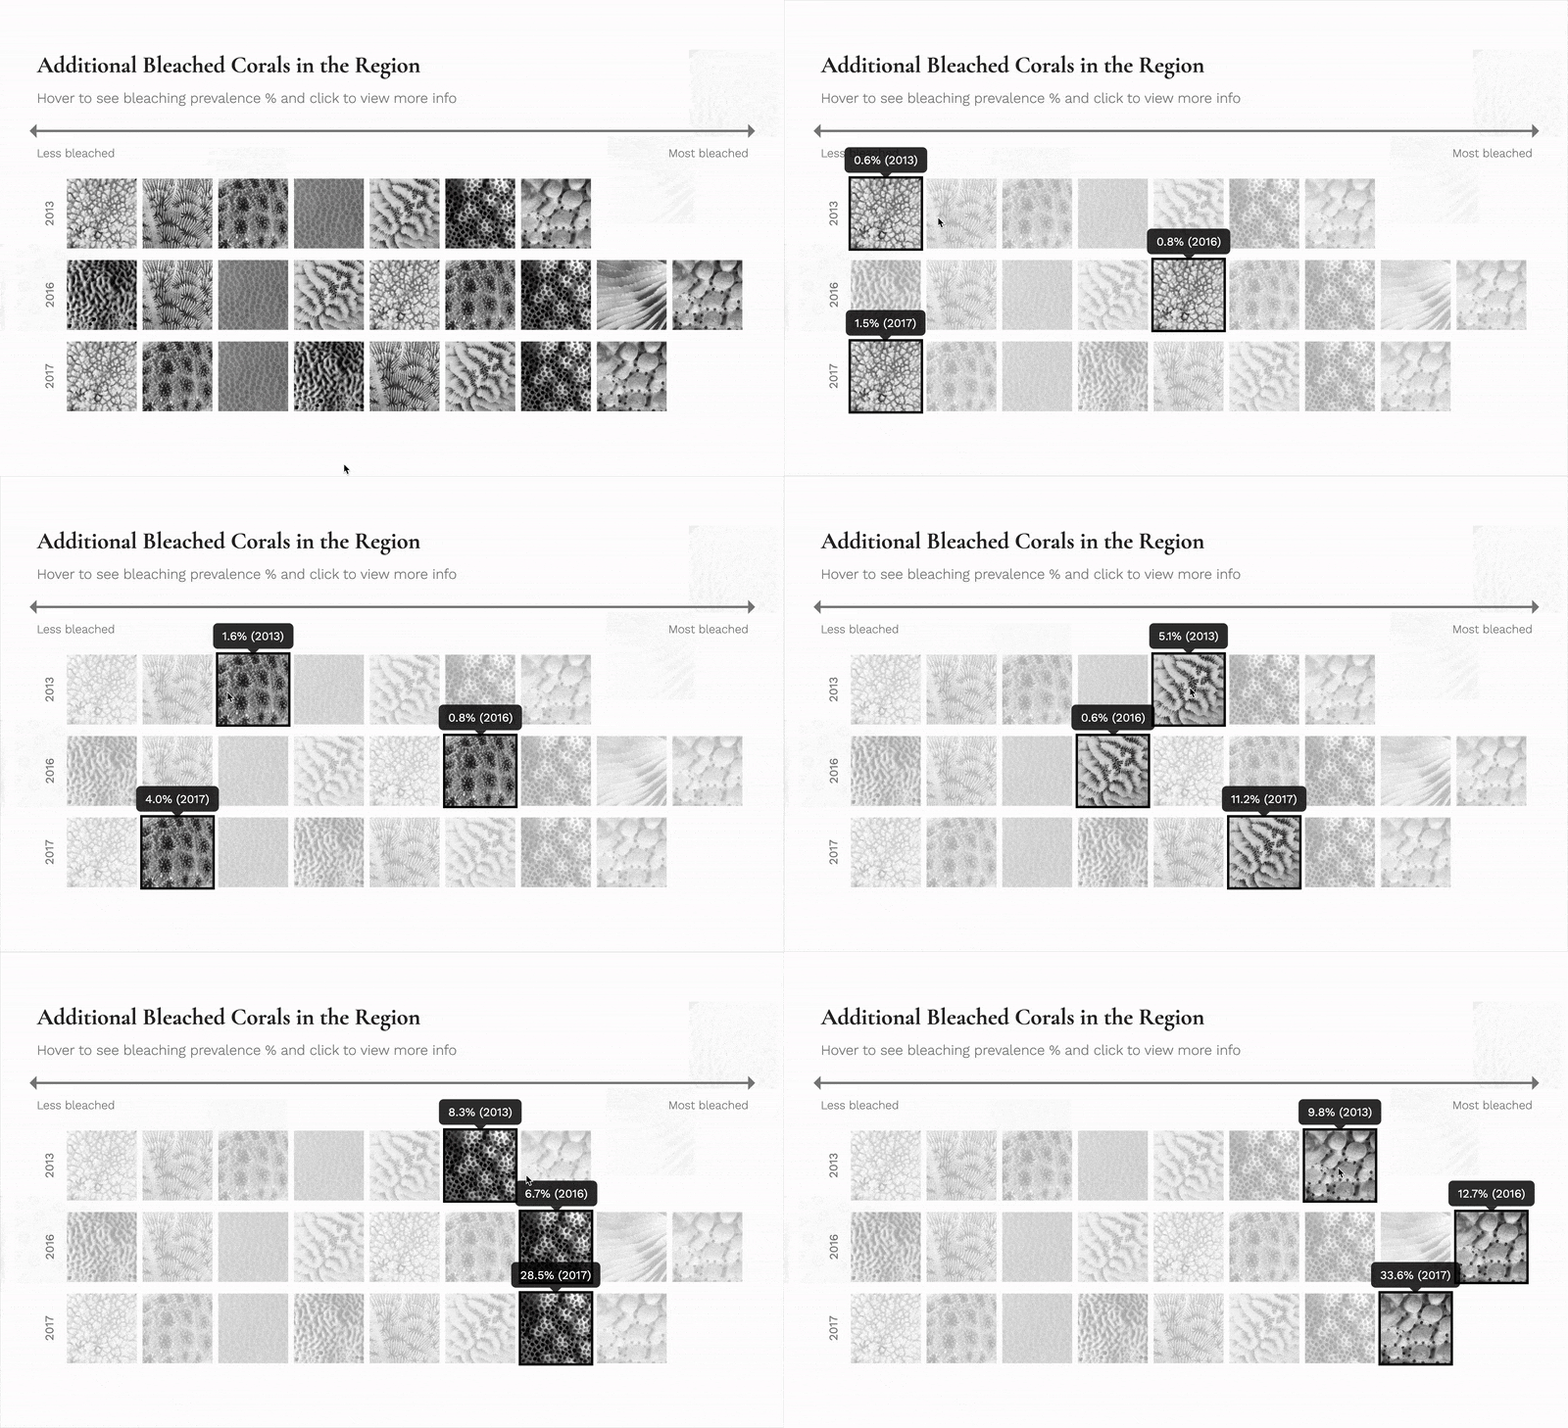
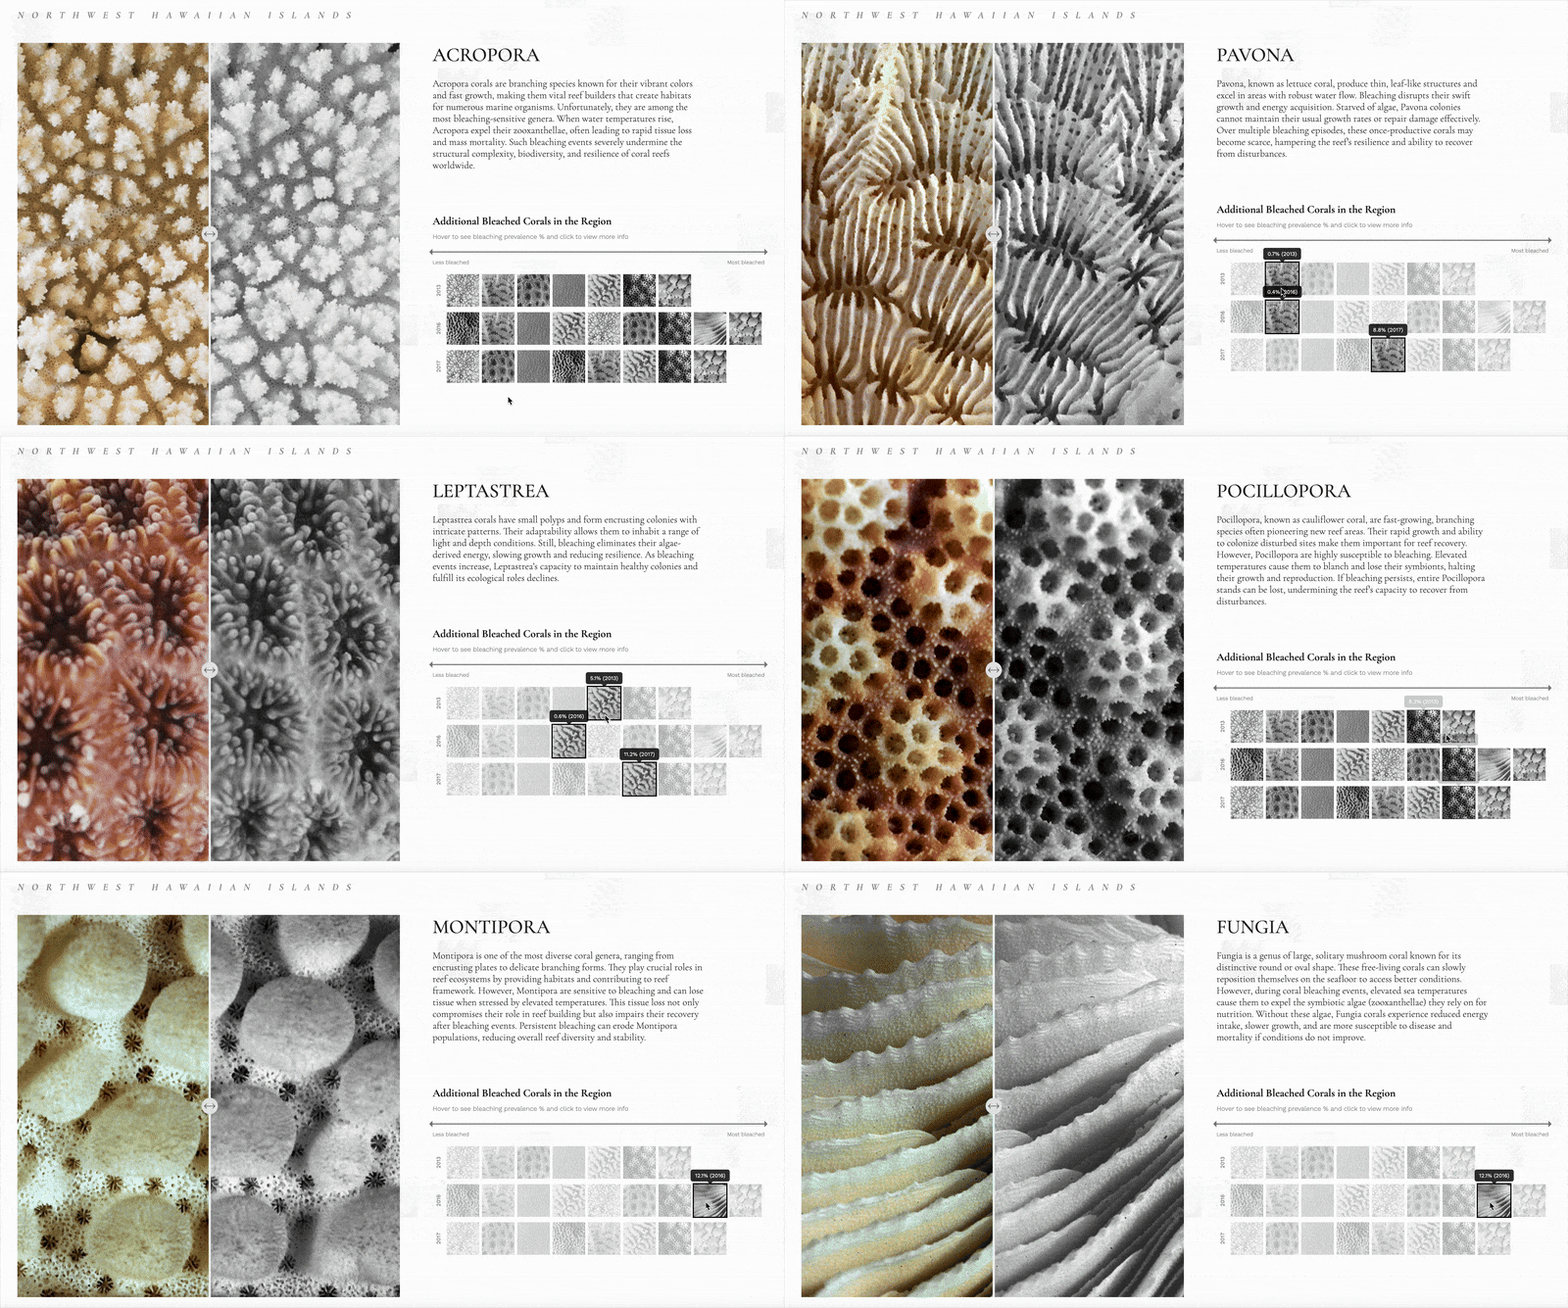
The row of images displays a progression from the least to the most bleaching recorded in that year.
Similar to the map page, hovering over coral images highlights genera surveyed over the years, which unfortunately highlights the increase in bleaching.
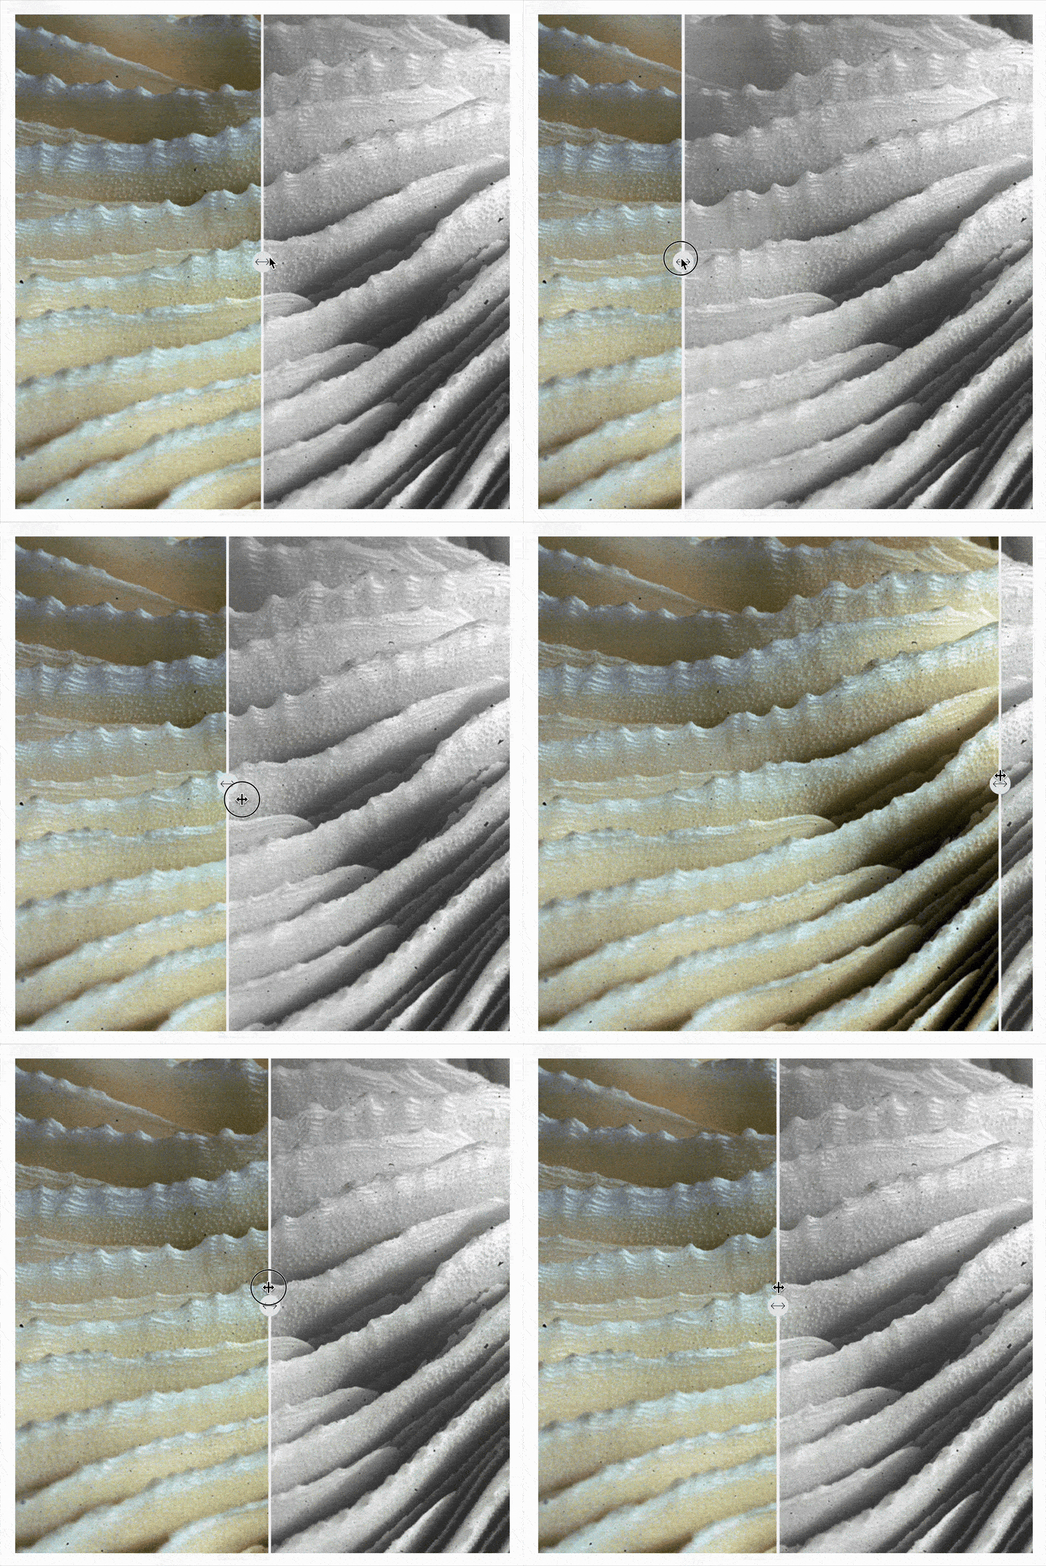
Clicking on an image allows for a deeper exploration of that coral genera. The interactive slider, allowing users to transition between colored and monochrome images, creates a dramatic visual impact intended to inspire environmental action.
There is hope for corals!
Dive into American Samoa, where coral bleaching is on the decline—a promising sign of resilience being studied by the Smithsonian Tropical Research Institute.
Intriguingly, American Samoa is part of the NOAA's National Marine Sanctuary system, the largest and most remote sanctuary of its kind. This protected status could be key to the region's progress in reducing coral bleaching.
The Smithsonian houses the largest coral collection in the world
Efforts like the Healthy Reefs for Healthy People Initiative monitor coral reef health, with improvements in some regions attributed to community and government interventions. The Smithsonian’s National Zoo and Conservation Biology Institute has pioneered coral cryopreservation, creating repositories containing 1 trillion frozen sperm and 3 billion larval cells from 16 species.
Meanwhile, the Smithsonian Tropical Research Institute explores resilient "super corals" off Panama's coast, offering hope for the future of coral reefs.
